
# Packages (apologies, this is a dependency heavy script!)
pacman::p_load("mlbench","grf","cfcausal","caret",
               "reshape2","glmnet","tidyverse", "ggthemes",
"ggdist","ggpubr")This post briefly demonstrates how to generate conformal uncertainty bands/intervals in R employing the cfcausal package wrapped around the local linear forest estimator from the grf package. I don’t spend much time here explaining how conformal intervals are constructed, for that see (Lei et al. 2018) and (Samii 2019).
For the purpose of this demo, we’ll use a modified version of the data generating process (DGP) from (Friedman 1991), namely:
\[y=10 \sin (\pi x 1 x 2)+20(x 3-0.5)^2+10 x 4+5 x 5+e\]where \(e \sim N(0,1)\). In addition to the five covariates that are related to the outcome, there are also 25 noise covariates unrelated to the outcome (all \(\sim N(0,1)\)). This particular DGP has proved challenging for the Gaussian confidence intervals constructed using the standard local linear forest method (see the Monte Carlo simulations presented in (Friedberg et al. 2020), equation 7).
DGP simulated below:
# Set seed for reproducibility
set.seed(1995)
# Simulate the DGP
p <- 20 #20 additional predictor vars
n <- 500 #sample size
junk <- matrix(rnorm(n * p), n, p) #junk predictors
data <- mlbench::mlbench.friedman1(n) #friedman MARs DGP...
data <- data.frame(y = data$y, x = data$x,junk) #...adding more junk
#
# Split train/test set
trainIndex <- caret::createDataPartition(data$y, p=0.7, list = FALSE) #70/30 split
train <- data[trainIndex,]
test <- data[-trainIndex,]
#
# Convenience objects
Y <- train$y
Y.test <- test$y
X <- train[,-1]
X.test <- test[,-1]
#
Now we can move on to training the local linear forest, we’ll enable the local linear split feature and use cross-validated lasso to select the correction features.
# local linear regression forest with LL splits enabled
c.forest.ll <- grf::ll_regression_forest(X = as.matrix(X), Y = Y,
                                    #tune.parameters = "all", #can't have this with ll splits, IRL you'd want to do a custom tuning loop
                                    enable.ll.split = TRUE, ll.split.weight.penalty = TRUE,
                                    num.trees = 4000, #upping from default for stable variance estimates
                                    seed = 1995)
#
# Select covariates for local linear correction
lasso.mod  <- glmnet::cv.glmnet(as.matrix(X), Y, alpha = 1,  nfolds = 20) #cross-validated lasso
lasso.coef <- predict(lasso.mod, type = "nonzero")
selected   <- lasso.coef[,1]
#
# out-of-sample preds, could also look at oob preds (leave out the testing set and use X instead)
preds.ll <- predict(c.forest.ll,X.test,estimate.variance = TRUE,linear.correction.variables = selected)
# data frame for plots later, adding built-in grf uncertainty intervals
plot.df <- data.frame(ll.preds   = preds.ll$predictions,
                      ll.upper   = preds.ll$predictions + 1.96*sqrt(preds.ll$variance.estimates), #grf 95% confidence intervals
                      ll.lower   = preds.ll$predictions - 1.96*sqrt(preds.ll$variance.estimates),
                      Y = Y.test)
# column to indicate whether the uncertainty band contains the true value (for plotting)
plot.df$ll.cover   <- as.factor(ifelse(Y.test >= plot.df$ll.lower & Y.test <= plot.df$ll.upper,1,0))
In order to generate the conformal intervals, we first need to setup a function that will estimate the local linear forest model.
# Setup the llf function to plugin to cfcausal, same settings and seed as above
llRF <- function(Y, X, Xtest, ...){
  fit <- grf::ll_regression_forest(X, Y,  enable.ll.split = TRUE,
                                   ll.split.weight.penalty = TRUE,num.trees = 4000,seed = 1995,...)

  # Same selection procedure
  lasso.mod <- glmnet::cv.glmnet(as.matrix(X), Y, alpha = 1,  nfolds = 20)
  lasso.coef <- predict(lasso.mod, type = "nonzero")
  selected <- lasso.coef[,1]
  #
  # out-of sample preds
  res <- predict(c.forest.ll,Xtest,estimate.variance = FALSE,linear.correction.variables = selected) #turn off grf variance estimates
  #
  res <- as.numeric(res$predictions)
  return(res)
}
We can then feed that function into the cfcausal::conformal function to generate unweighted standard conformal intervals.
# Setup the conformal prediction function plugging in our llf estimator
c.test <- cfcausal::conformal(X = X,Y = Y, type = "mean", side = "two",
                              wtfun = NULL, #unweighted
                              outfun = llRF, #our custom output function
                              useCV = FALSE) # Note: we're using split conformal here, you could alternatively use CV+ by setting useCV = FALSE.
ll.preds.conformal <- predict(c.test,X.test,alpha = .025) #generate the uncertainty bands, here we're .025
# Save out the results
plot.df$ll.upper.c <- ll.preds.conformal$upper
plot.df$ll.lower.c <- ll.preds.conformal$lower
# Column for whether truth is covered or not in a given instance, for plotting
plot.df$ll.cover.c <- as.factor(ifelse(Y.test >= plot.df$ll.lower.c & Y.test <= plot.df$ll.upper.c,1,0))
Now we can plot a comparison between the local linear forest model predictions wrapped in the standard Gaussian and conformal intervals (both aiming for 95% coverage). The y-axis here is model predictions and associated uncertainty bands, the X axis are the true values for y in the testing set.
# llf plot with grf uncertainty bands
ll.plot <- plot.df %>%
           ggplot(aes(y = ll.preds, x = Y.test, ymin = ll.lower, ymax = ll.upper,color = ll.cover)) +
           geom_pointinterval(alpha = .5,shape = 1) +
           scale_x_continuous(limits = c(0,30), expand = c(0, 0)) +
           scale_y_continuous(limits = c(0,30), expand = c(0, 0)) +
           geom_abline(linewidth = .75, intercept = 0,slope = 1) +
           ylab("LLF Predictions (Y), 95% Confidence Intervals") +
           xlab("Y (Real, Test Set)") +
           ggtitle("Local Linear Forests") +
           ggthemes::theme_few()+
           scale_color_manual(values = c("firebrick1","dodgerblue")) +
           guides(color=guide_legend(title="Cover Truth? (Blue = Yes)")) +
           annotate("text", x = 20, y = 5, label = "Coverage == .28",
           parse = TRUE)
# llf plot with conformal bands
ll.plot.c <- plot.df %>%
             ggplot(aes(y = ll.preds, x = Y.test, ymin = ll.lower.c, ymax = ll.upper.c,color = ll.cover.c)) +
             geom_pointinterval(alpha = .5,shape = 1) +
             scale_x_continuous(limits = c(0,30), expand = c(0, 0)) +
             scale_y_continuous(limits = c(0,30), expand = c(0, 0)) +
             geom_abline(linewidth = .75, intercept = 0,slope = 1) +
             ylab("LLF Predictions (Y), 95% Conformal Intervals") +
             xlab("Y (Real, Test Set)") +
             ggtitle("LL Forests w/ Conformal Bands") +
             ggthemes::theme_few()+
             guides(color=guide_legend(title="Cover Truth? (Blue = Yes)")) +
             scale_color_manual(values = c("firebrick1","dodgerblue")) +
           annotate("text", x = 20, y = 5, label = "Coverage == .95",
           parse = TRUE)
#
ggpubr::ggarrange(ll.plot,ll.plot.c,nrow = 1,common.legend = TRUE,legend = "bottom") 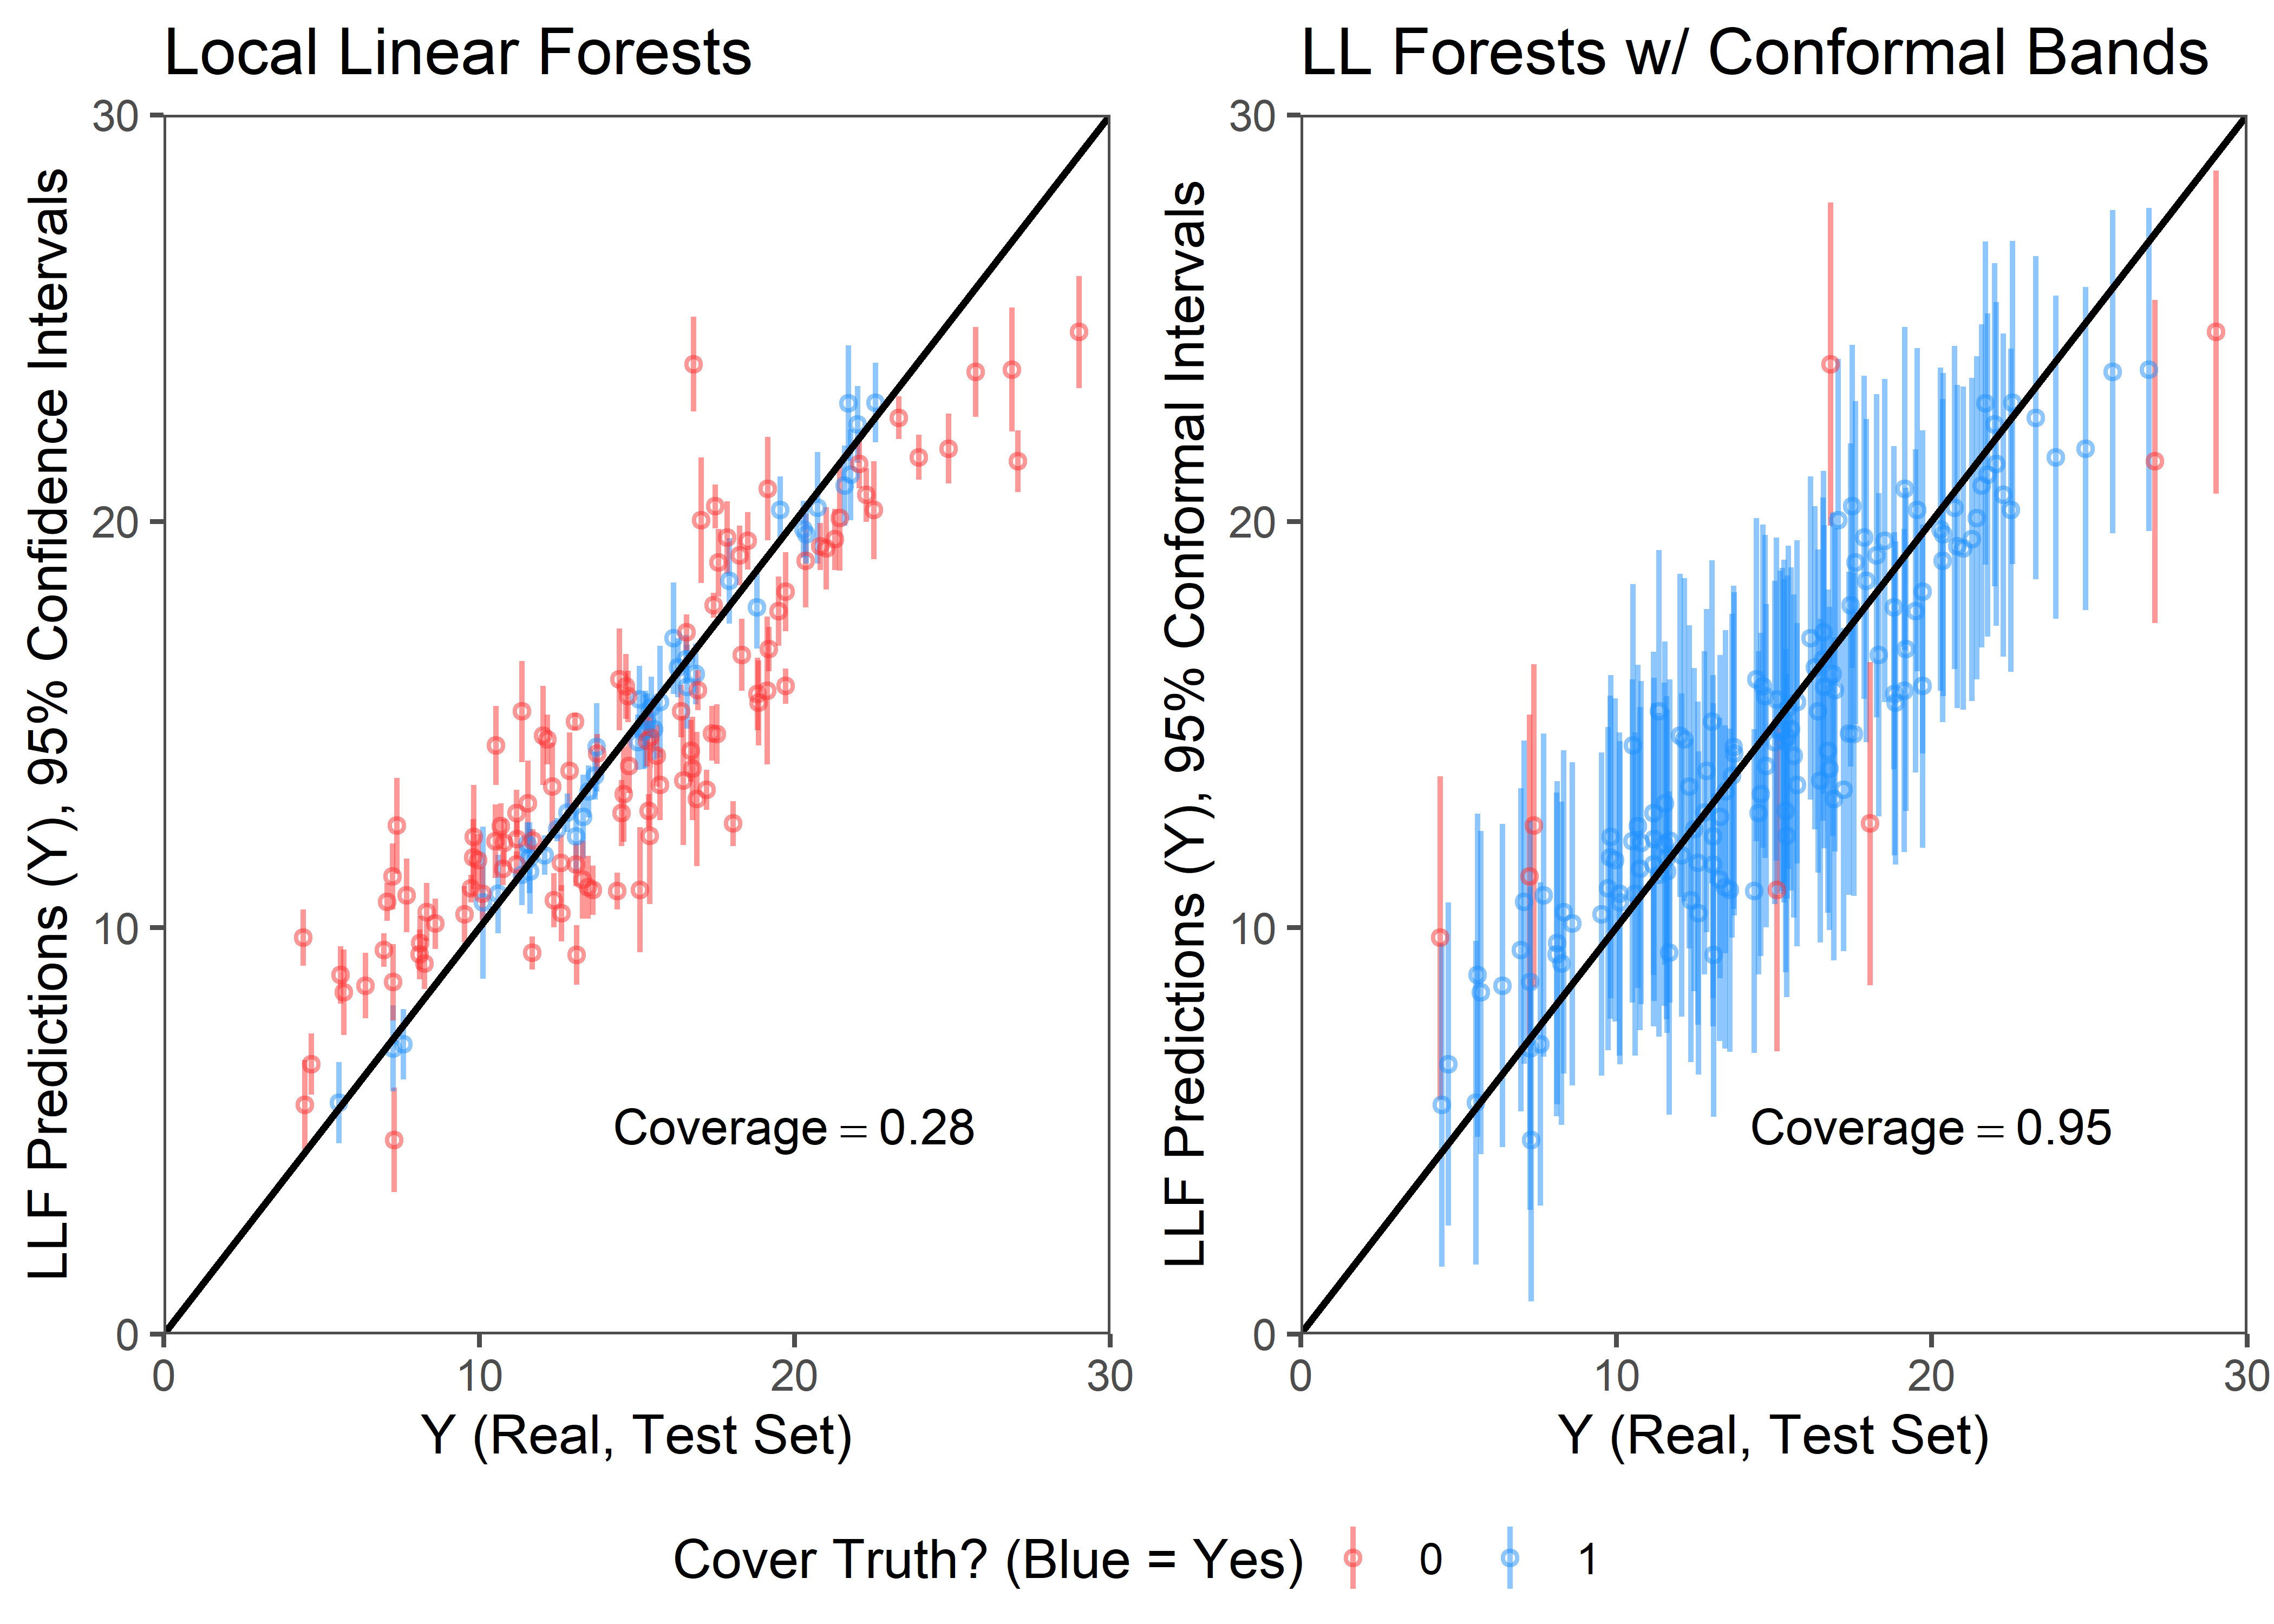
As the figure makes clear, the conformal bands achieve a much better coverage rate relative to the Gaussian confidence bands. Indeed, in this particular example the conformal approach reaches exactly the desired 95% coverage, while the Gaussian confidence bands achieve only 28%.
References
Friedberg, Rina, Julie Tibshirani, Susan Athey, and Stefan Wager. 2020. “Local Linear Forests.” Journal of Computational and Graphical Statistics 30 (2): 503–17.
Friedman, Jerome H. 1991. “Multivariate Adaptive Regression Splines.” The Annals of Statistics 19 (1): 1–67.
Lei, Jing, Max G’Sell, Alessandro Rinaldo, Ryan J Tibshirani, and Larry Wasserman. 2018. “Distribution-Free Predictive Inference for Regression.” Journal of the American Statistical Association 113 (523): 1094–1111.
Samii, Cyrus. 2019. “Conformal Inference Tutorial.” 2019. https://cdsamii.github.io/cds-demos/conformal/conformal-tutorial.html.
Citation
BibTeX citation:
@online{t.rametta2023,
  author = {Jack T. Rametta},
  title = {Conformalized {Local} {Linear} {Forests}},
  date = {2023-08-12},
  url = {https://cetialphafive.github.io/jrametta/posts/2023-08-12-conformal/},
  langid = {en}
}
For attribution, please cite this work as:
Jack T. Rametta. 2023. “Conformalized Local Linear
Forests.” August 12, 2023. https://cetialphafive.github.io/jrametta/posts/2023-08-12-conformal/.